
SaaS Dashboards: Examples and Templates to unlock data-driven success.
Everything you need to know around SaaS Dashboards. From definition, examples, benefits and templates get an in-depth understanding of building an effective SaaS Dashboard.

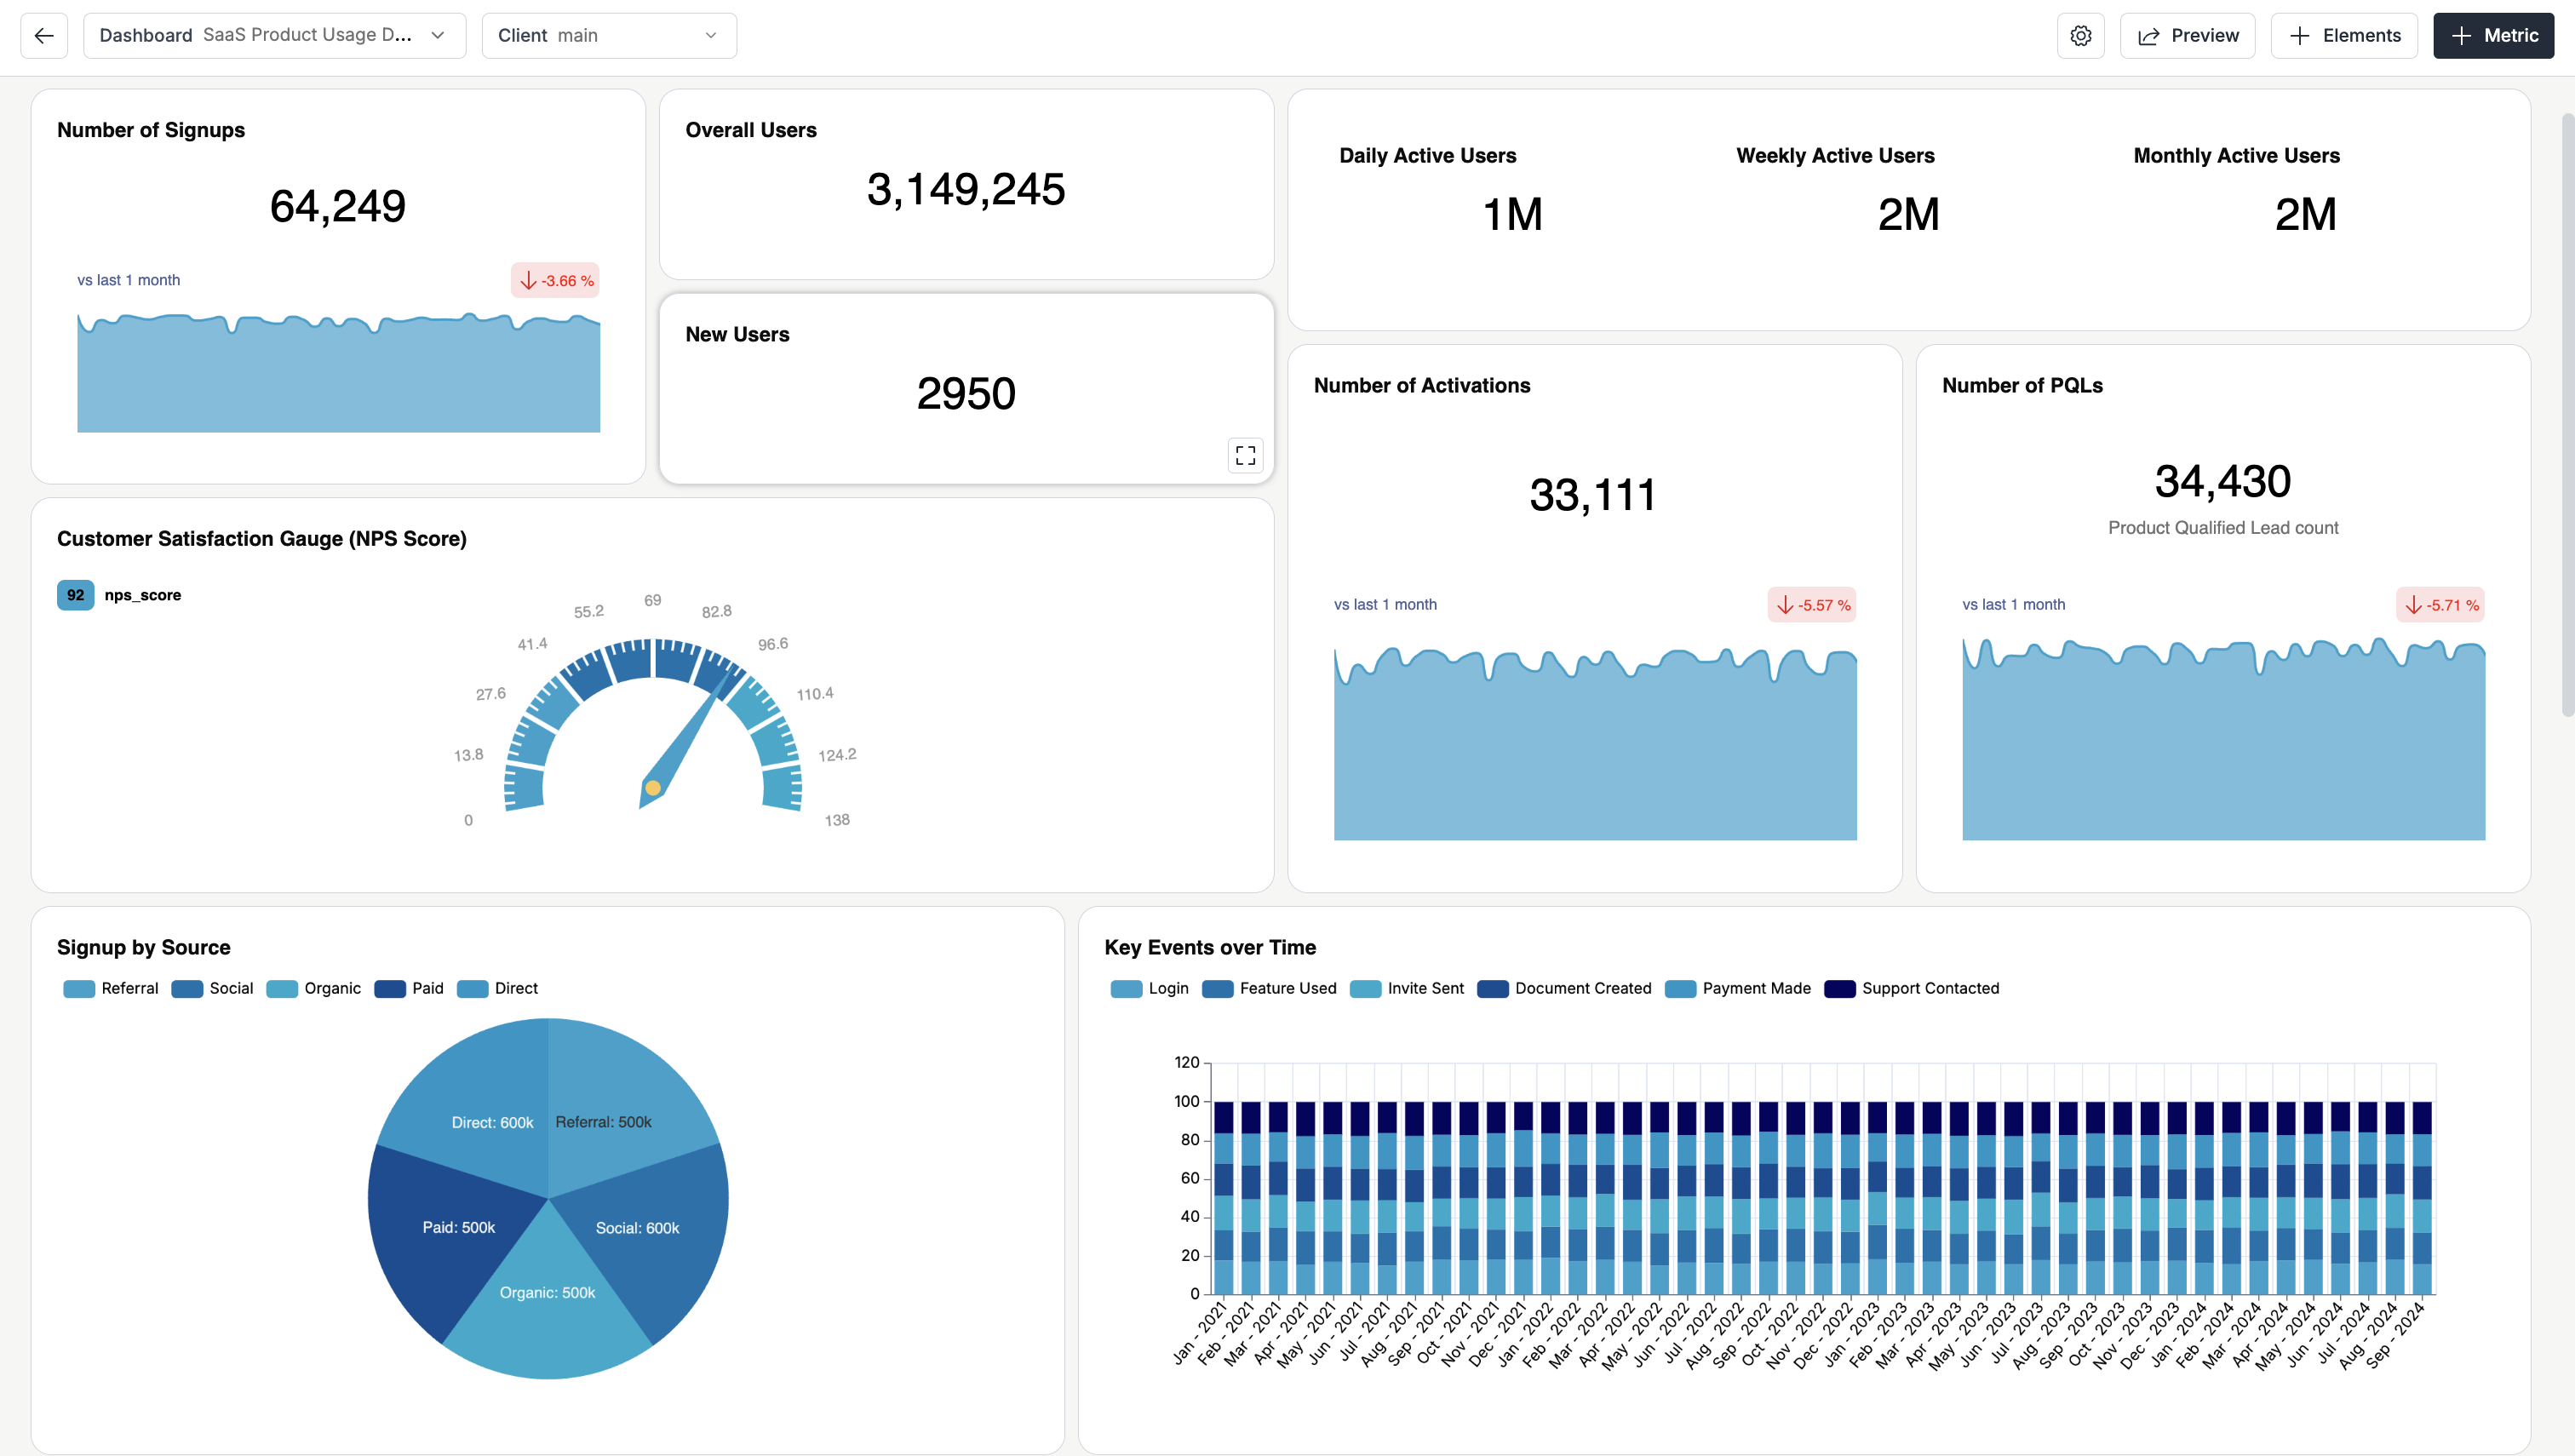
.png)
Over the last decade, we've seen the world embrace the subscription model. In the tech landscape, the emergence of SaaS businesses is a testament to that. Though we've come a long way in understanding the SaaS business model, data analysis from acquisition to revenue recognition, involves a lot of nuance and detail as to how we should measure these metrics and make business decisions. While we understand these metrics well, it is equally important that we visualize and monitor them regularly, and building an effective and usable SaaS dashboard is key to that.
What is a SaaS Dashboard?
A SaaS Dashboard allows you to view critical metrics that determine the performance of a particular role, function, and business. Think of a good SaaS dashboard as the cockpit of an airplane, providing you with all the essential information you need to navigate your KPIs.
Benefits of a good SaaS dashboard?
A well-designed data visualisation dashboard is more than just a pretty interface. It's a powerful tool that can transform how you operate your business. Here's how
- Agile decision-making: A good dashboard should immediately give you an overview of trends. Irrespective of your vantage point in the business identifying these trends and making quick decisions is key to building a solid SaaS business.
- Democratized data access: Dashboards, specifically in the SaaS ecosystem don't need to be limited only to the 'data teams'. Giving business users from C-suite executives to the junior most employees access to dashboards can foster a data-driven culture across your organization.
- Improved customer experience: By tracking user behavior and satisfaction metrics, you can quickly identify and address pain points in your product or service, leading to happier customers and reduced churn.
- Efficient resource allocation: With a clear view of which features are most used and which marketing channels are most effective, you can allocate your resources more efficiently, maximizing ROI.
- Predictive power: Over time, the trends visible in your dashboard can help you forecast future performance, allowing you to proactively address challenges and seize opportunities.
Key Elements of a SaaS Dashboard
Whether you are building a dashboard for internal use or creating embedded reporting for your customers, ensure your dashboarding software provides these elements
- Customizable widgets: Every team/customer has unique needs. Look for dashboards that allow you to create and arrange widgets that display the exact metrics each team needs.
- Data visualization options: Humans process visual information faster than text. Your dashboard should offer various chart types (bar, line, pie, etc.) to represent data in the most intuitive way possible.
- Drill-down capabilities: Surface-level metrics are a good start, but the ability to click on a data point and see the underlying details is where real insights are uncovered.
- Goal tracking: Your dashboard should allow you to set and visualize progress toward key business objectives, keeping your team aligned and motivated.
- Embedding capabilities: If you're building customer-facing analytics dashboards, it should be easily embeddable into your app so your customers can easily use all your dashboard's features.
The most effective dashboard is one that's used. It's important to prioritize user experience and relevance over flashy features to ensure your usability.
How to Build a SaaS Dashboard?
Here's a step-by-step approach to building an effective dashboard.
- Define your goals and end-user: What do you want to achieve with your dashboard? Be specific about the metrics and the frequency with which you wish to track these metrics.
- Identify your KPIs: Choose metrics that align with your goals. Remember, less is often more.
- Choose your software: There are many dashboard software options out there. Pick one that fits your needs and budget.
- Design your layout: Arrange your metrics in a way that tells a story and makes sense for your team.
- Implement and test: Set up your dashboard and give it a thorough test drive before rolling it out to your team/customers.
Different types of Dashboards that you can build for a SaaS Business
Marketing Dashboards
Marketing dashboards are essential for tracking and optimizing marketing efforts across various channels. They provide insights into SaaS Marketing Metrics around campaign performance, lead generation, and overall marketing effectiveness.

Key Metrics in a Marketing Dashboard
- Marketing Qualified Leads (MQLs): The number of leads deemed likely to become customers. Indicates marketing effectiveness in attracting potential buyers.
- Customer Acquisition Cost (CAC): Total cost to acquire a new customer. Helps assess the efficiency of marketing and sales efforts.
- Marketing ROI: Return on investment for marketing activities. Measures the profitability of marketing spend.
- Brand awareness metrics: Indicators of how well-known your brand is. This can include social media mentions, search volume, and survey results.
- Website Traffic: Number of visitors to your site. A basic measure of your online reach and visibility.
- Lead Conversion Rate by Channel: Percentage of visitors who take a desired form submission based on the landing page the traffic is driven across each channel.
- Traffic sources: Where your visitors come from. Helps you understand which channels are driving traffic to your site.
Product Dashboards
Product dashboards help teams monitor and improve product performance, user engagement, and overall user experience. They provide valuable insights into how customers interact with the product and where improvements can be made.
Key Metrics in a Product Dashboard
- Daily/Monthly Active Users (DAU/MAU): Number of unique users engaging with your product daily or monthly. A key measure of product adoption and stickiness.
- Feature adoption rates: Percentage of users utilizing specific features. Helps identify popular features and those that may need improvement.
- User retention rates: Percentage of users who continue using your product over time. A crucial indicator of product satisfaction and value.
- Time spent in the app: Average duration users spend in your product. Can indicate user engagement and product utility.
- Error rates: Frequency of errors or crashes experienced by users. Crucial for monitoring product stability and user experience
- Load times: How quickly different parts of your product load. Important for user satisfaction and retention.
- Time to first value: How quickly new users reach their first "aha" moment. Key for improving early user experience and reducing chur
- User satisfaction scores: Direct feedback from users on their experience. Often collected through in-app surveys or Net Promoter Score (NPS).
- Onboarding completion rate: Percentage of new users who finish the onboarding process. Indicates the effectiveness of your onboarding flow.
Finance Dashboards
A Finance dashboard gives a comprehensive view of a company's financial health and performance. It helps finance teams, executives, and stakeholders make informed decisions about budgeting, investments, and financial strategy.

Key Metrics tracked in a Finance Dashboard
- Revenue growth: The rate at which your company's revenue is increasing. A fundamental measure of business health and market traction.
- Gross margin: Percentage of revenue remaining after direct costs. Indicates pricing power and operational efficiency.
- Cash burn rate: Shows how quickly you're spending cash reserves. Critical for managing runway and planning fundraising.
- Budget vs. actual spend: Comparison of planned and actual expenses. Helps in controlling costs and adjusting financial strategies.
- Forecasted revenue: Projected future revenue based on current trends and pipeline. Crucial for planning and setting expectations.
- Cash flow projections: Estimated future cash inflows and outflows. Essential for managing liquidity and avoiding cash crunches.
- Cost of Goods Sold (COGS): Direct costs associated with producing goods or services sold. Helps in calculating gross profit.
- Operating Cash Flow: Cash generated from core business operations. Indicates the company's ability to generate cash from its main activities.
Sales Dashboards
Sales dashboards provide real-time insights into sales performance, pipeline health, and revenue forecasts. They help sales teams stay on top of their targets and optimize their selling strategies.

Key metrics tracked in a Sales Dashboard
- Total revenue: Overall income generated from sales. The most direct measure of sales performance.
- Average deal size: Typical value of closed deals. Helps in forecasting and identifying upsell opportunities.
- Win rate: Percentage of deals closed compared to total opportunities. Measures sales team effectiveness.
- Quota attainment: Percentage of sales target achieved by each rep. Key for evaluating individual performance.
- Number of deals won: Total successful sales made by each rep. A straightforward measure of productivity.
- Sales cycle length: Average time from lead to closed deal. Helps identify bottlenecks in the sales process.
- Pipeline value: Total potential revenue in the sales pipeline. Helps forecast future revenue and sales team capacity needs.
- Number of new opportunities: Fresh leads entering the pipeline. Indicates the health of lead generation efforts.
Customer Support Dashboards
Customer support dashboards help teams monitor and improve the quality of customer service. They provide insights into support efficiency, customer satisfaction, and common issues that customer facing teams come across.
.png)
Key Metrics to track in a Customer Support Dashboard
- Ticket volume: Number of support requests received. Indicates overall support workload and potential product issues.
- Average resolution time: The time taken to solve a particular customer ticket. A key measure of support efficiency and customer satisfaction.
- Customer Satisfaction Score (CSAT): Direct feedback on support interactions. Measures the quality of your customer service.
- First Contact Resolution rate: Percentage of issues resolved in a single interaction. Indicates support team efficiency and knowledge.
- Net Promoter Score (NPS): Likelihood of customers recommending your product. A widely used measure of overall customer satisfaction and loyalty.
- Customer Effort Score (CES): Ease of resolving issues or using the product. Lower effort often correlates with higher satisfaction and retention.
- Churn risk indicators: Signals that a customer might leave. This could include reduced usage, support tickets, or engagement metrics.
Should I Embed a SaaS Dashboard or Build it In-House for my SaaS?
When it comes to building a customer-facing dashboard for your SaaS dashboard, you have two main options embedding a prebuilt solution or building one in-house. While both approaches have their merits, embedding a dashboard often proves to be the smarter choice for most SaaS companies. Here's why
Time to market: Embedded dashboards can dramatically reduce your building time. Instead of spending months developing a dashboard from scratch, you can have a fully functional solution up and running in days or weeks and market to your customers faster.
Cost-effectiveness: Building a dashboard in-house requires significant investment in development resources, ongoing maintenance, and updates. Embedded solutions spread these costs across multiple clients, often resulting in a more affordable option, especially for small to medium-sized businesses.
Expertise and best practices: Dashboard providers specialize in data visualization and analytics. By choosing an embedded analytics software, you're tapping into years of expertise and industry best practices, ensuring a high-quality user experience from day one for your customers.
Scalability and performance: Professional dashboard solutions are built to handle large amounts of data and concurrent users. They often come with a robust infrastructure that can scale as your business grows, giving you more data, faster queries, superior analytics, and faster insights for your customers.
Focus on core competencies: Your development team can focus on improving your core product rather than getting bogged down in the intricacies of building and maintaining a complex dashboard system.
Compliance and security Many embedded solutions come with built-in compliance features (like GDPR, SOC2, HIPAA, etc.) and robust security measures, saving you the headache of implementing these crucial elements yourself.
While building in-house does seem to offer more customization options, the benefits of embedding often outweigh this advantage for most SaaS companies. Modern embedded solutions like DataBrain offer significant customization capabilities, allowing you to tailor the dashboard to your specific needs without the overhead of full in-house development.
Learn how DataBrain helps you build interactive customer-facing analytics within any application today. Sign up for Free.


