

.png)
Running a retail business can take time and effort. Without precise data, you might be:
- Stuck with too much inventory, wasting space and money
- Sending out marketing messages that don't connect with your target audience
- Making your customers feel frustrated because you don't understand their needs
These issues can hold your business back from reaching its full potential.
Retail analytics can address these problems using customer data and sales information and help you make informed decisions. With retail analytics, you can:
- Understand your customers in more detail
- Manage your inventory more effectively
- Create targeted marketing campaigns
- Improve the customer experience
- Boost sales and profits
What is retail analytics?
Retail analytics is collecting and analyzing data about your business to improve operations and decision-making. This data can come from various sources, including:
- Sales transactions: This shows what customers buy and how much they spend.
- Inventory management systems: This tracks stock levels and helps avoid stockouts or overstocking.
- Customer relationship management systems (CRMs): This stores customer information like purchase history and preferences.
By analyzing this data, you can gain valuable insights into your business. For example, you can see:
- Which products are selling well and which ones aren't?
- What are your customers' buying habits?
- How effective are your marketing campaigns in driving sales?
.png)
Types of data analyzed in retail:
Retail analytics thrives on the information you gather about various aspects of your business. Here are three critical types of data analyzed in retail:
- Sales data: This is the core of retail analytics. It includes details like:some text
- Products sold: Knowing which items fly off the shelves and which need help with inventory management and product placement
- Sales volume: This reveals overall sales trends and helps identify peak seasons or underperforming periods.
- Customer spending: Analyzing average purchase value can indicate customer segments and inform pricing strategies.
- Inventory data: some text
- Stock levels: Knowing exactly how much of each product you have helps prevent stockouts and wasted storage space.
- Product movement: This data reveals how quickly products sell, allowing you to optimize ordering and restocking.
- Product location: Knowing where each item is stored makes inventory management faster and more efficient.
- Customer data: some text
- Demographics: Age, location, and income level can help segment your customer base and tailor marketing efforts.
- Purchase history: It reveals customer preferences and buying habits, allowing for personalized recommendations and targeted promotions.
- Customer feedback: Surveys and reviews offer valuable insights into customer satisfaction and areas for improvement.
Role of data analytics in understanding consumer behavior
- Uncovering buying patterns: Analyze purchases to see what the customers frequently buy together. Example: A retail bakery finds that customers buy muffins and coffee together in the mornings. They can use this data to create a special breakfast combo offering discounts on both items, encouraging impulse purchases.
- Understanding preferences: Track website clicks to see which products a customer lingers on. Example: An online clothing store notices a customer clicks on athletic wear and browses them for a long time. You can recommend athletic wear at a discounted price to move them closer to completing a purchase.
- Customer churn rate and insights: Analyze the purchase history of churning customers. Example: A subscription service sees many cancellations after the free trial. They can offer targeted discounts to entice these customers to stay.
Retail analytics cuts through the noise, giving retailers the power to know their customers truly. It translates to a more relevant shopping journey, building stronger relationships and boosting sales.
Steps to implementing data analytics in retail
Define business goals and objectives: Let's say your goal is to reduce out-of-stock situations for popular clothing items by 50% within the next six months. To achieve this, you'll need a three-step approach:
1. Data collection and cleaning:
- Collect sales and inventory data from your point-of-sale (POS) system.
- Ensure data accuracy by cleaning it to remove duplicates or errors in product information and store it in a database.
2. Identify relevant data:
You need to identify clothing items with consistently high sales figures, their stock levels, and how quickly they sell.
It is difficult to identify these items manually, which brings us to the next point - choosing a BI tool.
3. Choose the right analytics tool:
While retail businesses often lack the technical expertise for creating data visualizations, a BI tool can help transform the raw data into a suitable visual format.
But, not all BI tools are created equal. For retail businesses, choosing a tool with a user-friendly interface and drag-and-drop functionality is beneficial.
DataBrain, Tableau, and Power BI are a few BI tools available in the market.
Let's take DataBrain, for example; along with the features mentioned above, it uses AI to answer your queries with charts or graphs in seconds, saving you time and effort.
This can help you forecast demand based on historical sales data and current inventory levels.
4. Data analysis and interpretation:
Use the BI tool to analyze sales inventory and look for trends:
- Are there specific clothing items consistently selling out quickly?
- Are there seasonal fluctuations in demand for certain clothing types (e.g., higher demand for winter coats in colder months)?
- Analyze historical sales data to see if there are predictable peaks in demand for specific clothing items.
For example, you might discover that a particular style of jeans consistently sells out within a week of being restocked.
Actionable insights and recommendations:
Based on the findings, develop specific actions:
- Increase order quantities for high-demand clothing items: Knowing which item is popular allows you to order more units from your supplier to avoid stock-outs.
- Implement forecasting models: Use historical sales data to predict future demand for popular items and adjust ordering schedules accordingly.
- Optimize inventory allocation across stores: Analyze sales data from different locations to identify which stores sell more of a particular clothing item, allowing for strategic inventory allocation.
Monitor and measure results:
Once you've implemented changes based on data insights, track critical metrics:
- Monitor out-of-stock rates for popular clothing items.
- Track overall customer satisfaction.
Monitor performance and adapt your inventory management strategy based on new data insights.
Following these steps, you can leverage data analytics to gain valuable insights into customer demand for clothing items. It allows you to optimize your inventory management, reduce out-of-stock situations, and ultimately improve customer satisfaction within your retail store.
Emerging technologies in retail data analytics
Here's a quick breakdown:
- AI: A broad range of intelligent technologies with retail applications like chatbots for customer service or video footage analysis to prevent theft
- ML: A subset of AI that allows computers to learn from data without explicit programming. ML algorithms power many of the advanced analytics applications in retail.
You can use these powerful tools for various applications in retail analytics, including:
- Demand forecasting: ML algorithms can analyze historical sales data and social media trends to predict future demand for specific products. This allows retailers to optimize inventory levels and avoid stock-outs or overstocking.
- Personalized product recommendations: ML can analyze a customer's purchase history, browsing behavior, and demographics to suggest products they're likely interested in. You can suggest these products using targeted email campaigns.
- Dynamic pricing: AI can adjust prices in real time based on factors like competitor pricing, customer demand, and local market trends. It ensures retailers stay competitive and maximize profits.
- Fraud detection: ML algorithms can analyze purchasing patterns to identify suspicious transactions and prevent fraud.
By incorporating AI and ML, retailers can gain deeper customer insights, automate tasks, and optimize their operations for a smarter and more profitable business.
Examples and use cases
Profit vs. loss geographically:
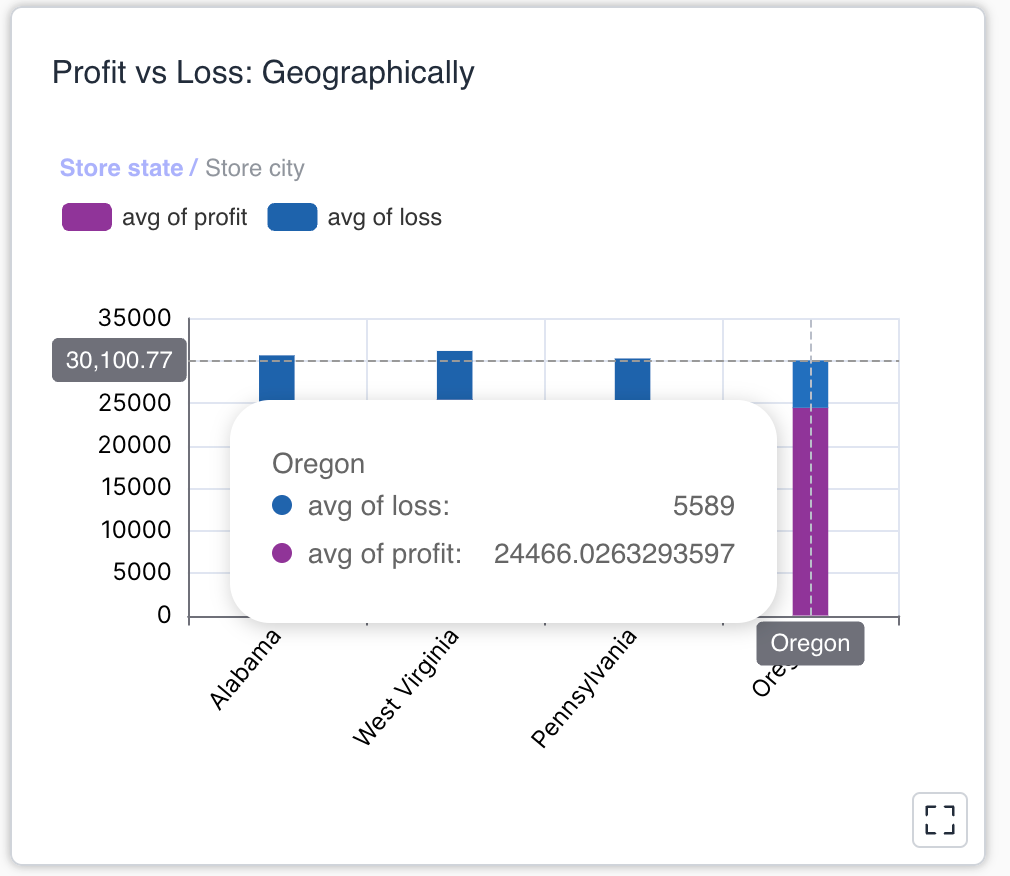
Profit vs. loss geographically is a technique used in business to understand how profitable a company is in different regions or locations. This analysis helps companies identify areas where they excel and areas that require improvement.
Benefits
- Resource allocation: By identifying profitable regions, companies can allocate more resources (marketing, inventory) to those areas.
- Identifying struggling locations: This analysis helps pinpoint regions with low profits or losses, prompting an investigation into cost reduction or sales improvement strategies.
- Market expansion decisions: Understanding regional profitability can guide decisions about expanding into new markets or exiting unprofitable ones.
Customer acquisition
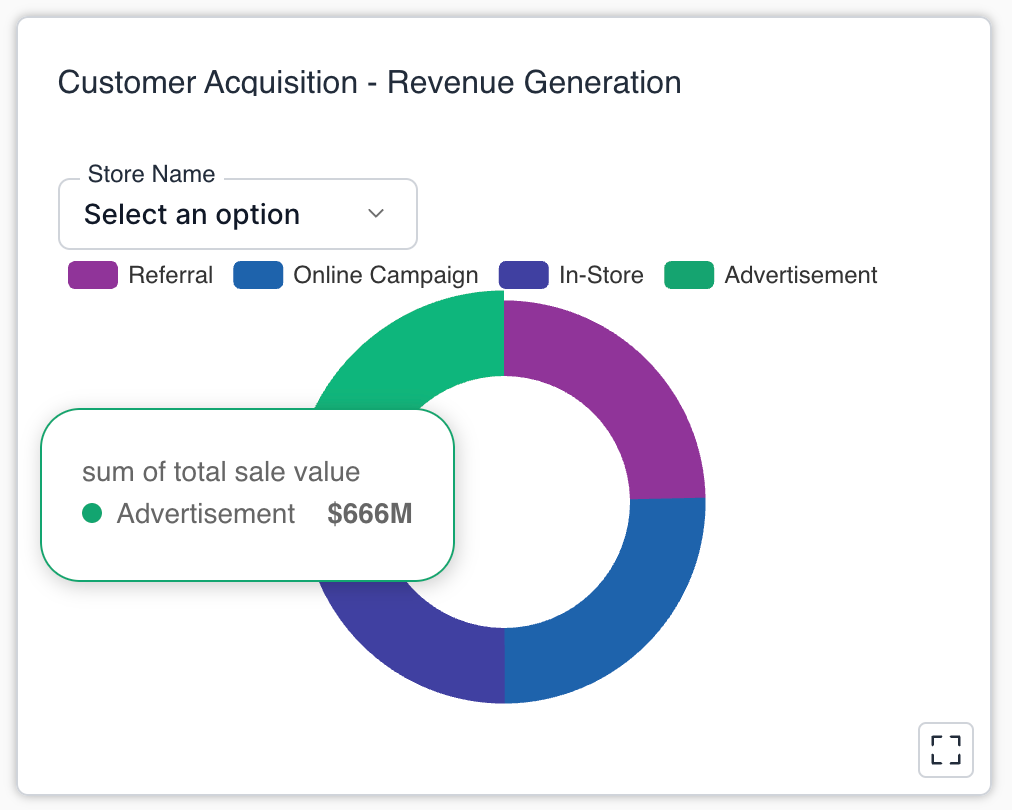
Let's say you run a bakery. You want to know two things:
- How many customers are you getting? (Customer Acquisition)
- How much money are those customers bringing in? (Revenue Generation)
Combining these two questions into one big picture helps the bakery understand the relationship between how you acquire customers and the money those customers bring in.
Here's an example:
The bakery spends a lot of money on online ads (high customer acquisition cost), but those who come from those ads buy only small-value products (low revenue).
This metric would show the bakery that there are more effective ways than online ads to get high-spending customers. They might consider other ways, like offering in-store promotions, to acquire customers.
By understanding this metric, the bakery can make smarter decisions about attracting customers who will bring in more money, making their business more successful.
Unit price for products:
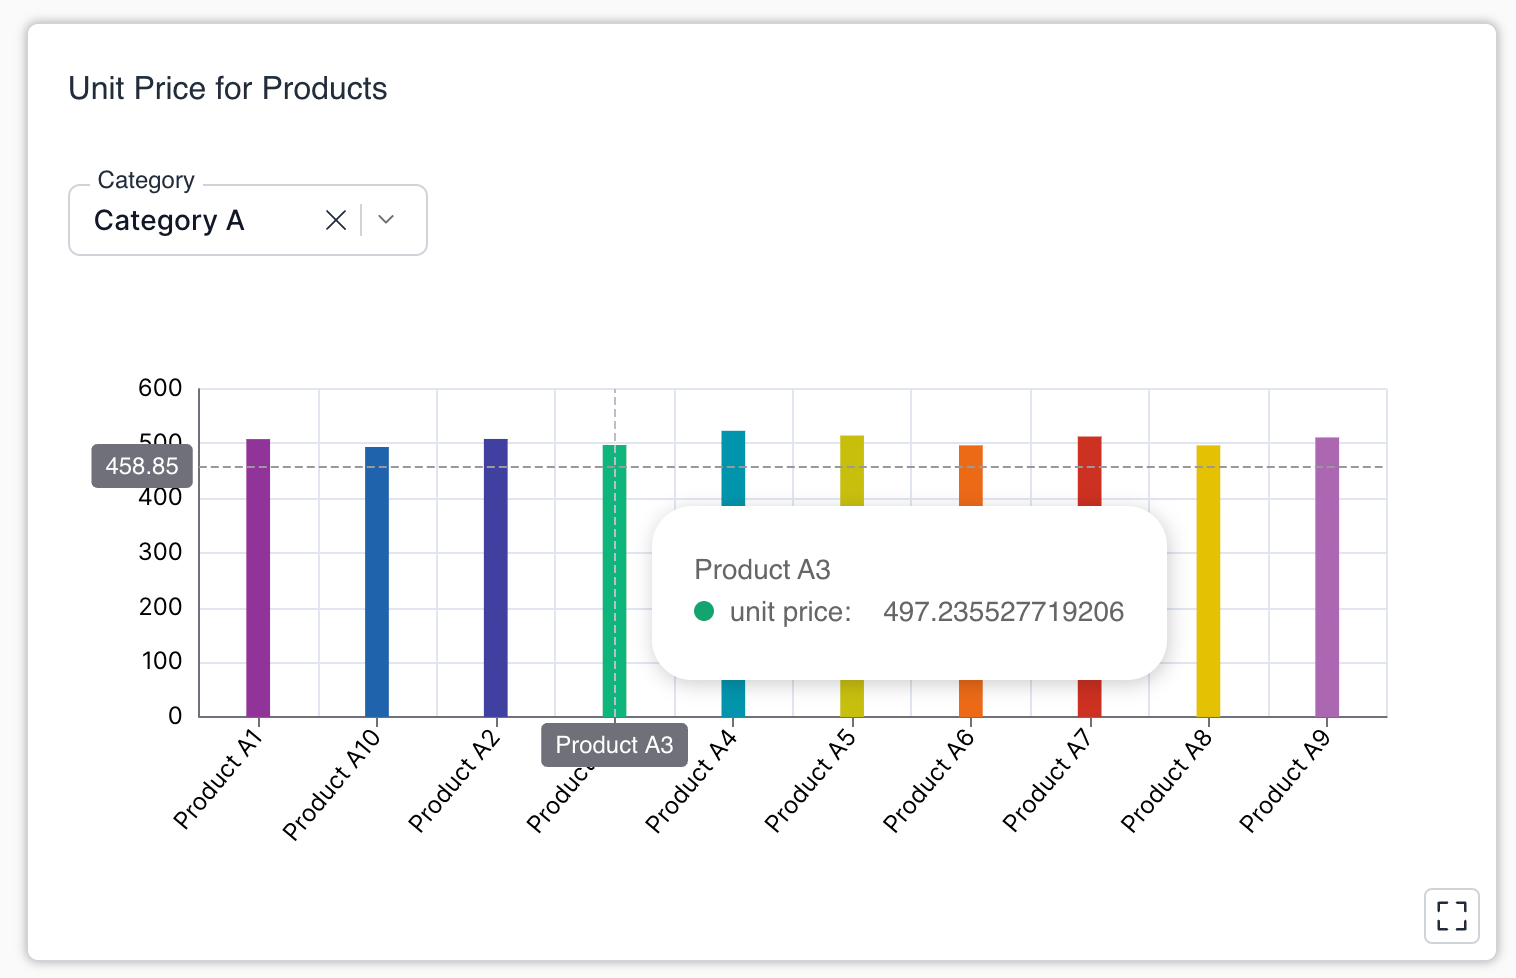
By looking at this chart, you can quickly see which product is the most expensive (the tallest colored bar) and which is the cheapest (the shortest colored bar). You can also easily compare prices between products of similar types (e.g., different varieties of apples) by looking at the heights of their colored bars.
This is a way of presenting data (unit price) clearly and visually appealingly (using a multi-colored chart) to make comparisons easier.
Conclusion:
Retail analytics gives you the tools to make winning decisions based on real customer data. You'll understand your customers better, keep them coming back, and see your sales soar. Start using retail analytics today and watch your business flourish!
If you understand the power of retail analytics, sign up for DataBrain to save time, understand customers better, and improve sales.
Many retail SaaS platforms embed customer-facing analytics dashboards in their products, distinct from internal BI.


