
Fintech data analytics: How to use data Analytics in Fintech
We summarize the key points or highlight how data analytics can improve decision-making and transform fintech business.

.png)
Key Takeaways
- Market & AI adoption: Fintech analytics is a fast-growing market (e.g. multi‑billion dollar scale through the decade), while a majority of finance leaders now use AI in operations lagging here means competing blind.
- Use cases that matter: Personalization, real-time fraud, alternative-data credit, customer analytics (including churn), and regulatory compliance (DORA, PSD3, EU AI Act) are the core levers, not generic “reporting.”
- Techniques: Predictive ML, NLP, strong visualization, time series, and network analysis plus agentic AI are how teams move from reactive dashboards to proactive intelligence.
- KPIs: Growth, engagement, and risk need one coherent set - e.g. CAC, MAU, ARPU, CLTV, NPS, churn, GPV, fraud/false-positive balance, and loan default rate reviewed on a real cadence, not vanity metrics.
- Product strategy: Embedded analytics for end users, real-time over batch, and honest build-vs-buy math (700K–700K–1.2M+ over years in-house vs. embedded platforms) decide whether analytics compounds or becomes technical debt.
Most fintech companies say they're "data-driven". Very few actually are.
They've got dashboards nobody checks, analytics tools gathering dust, and a data team buried under ad-hoc requests from product managers who needed answers yesterday. Sound familiar?
The business analytics in fintech market will hit $5.3 billion in 2026, growing at 25% year-over-year toward a projected $40 billion by 2035. That money is flowing somewhere. And if your company is still stitching together spreadsheets or waiting three weeks for a report from engineering, it's not flowing to you.
This article cuts through the noise. We'll cover the actual techniques fintech companies use, the KPIs worth tracking (and the ones that are vanity metrics in disguise), the use cases driving real revenue, and why embedded analytics for fintech products is becoming the dividing line between companies that scale and companies that stall. For a broader view of AI in analytics across industries, see our dedicated article.
Why Data Analytics Is the Backbone of Fintech
The Data Explosion in Financial Services
Every swipe, transfer, login, and loan application generates data. The broader financial data analytics market is on track to reach $18.5 billion by 2026 (15.3% CAGR), and it'll keep climbing to $32 billion by 2030. But raw data isn't the asset. Processed, actionable data is.
The gap between data-driven fintech companies and everyone else is widening fast. According to CFO Connect's State of AI in Finance 2026 report, 56% of finance leaders now use AI in their operations, double the adoption rate from 2023. If you're not in that majority, you're competing against people who can see things you can't.
From Reactive Reporting to Proactive Intelligence
Here's the fundamental difference between traditional financial analytics and fintech analytics: traditional analytics tells you what happened last quarter. Fintech analytics tells you what's happening right now and what's likely to happen next.
It's real-time, it's product-embedded, it's customer-facing. It pulls from alternative data sources: transaction patterns, device signals, open banking data, behavioral signals that traditional finance doesn't touch. And increasingly, it's not just for your internal team. It's for your users. More on that later.
Core Use Cases for Data Analytics in Fintech
Hyper-Personalization at Scale
A young professional uses your mobile banking app. Your data analytics layer picks up that they transfer money internationally twice a month and save 30% of their income. Instead of showing them generic product tiles, your app recommends a multi-currency account with lower transfer fees and investment options matched to their savings goals.
That's not a hypothetical. That's what the best fintech companies are doing right now with customer segmentation and payment analytics. Open banking data makes this even more powerful. In 2026 you can see a user's financial life across institutions, not just what happens inside your app.
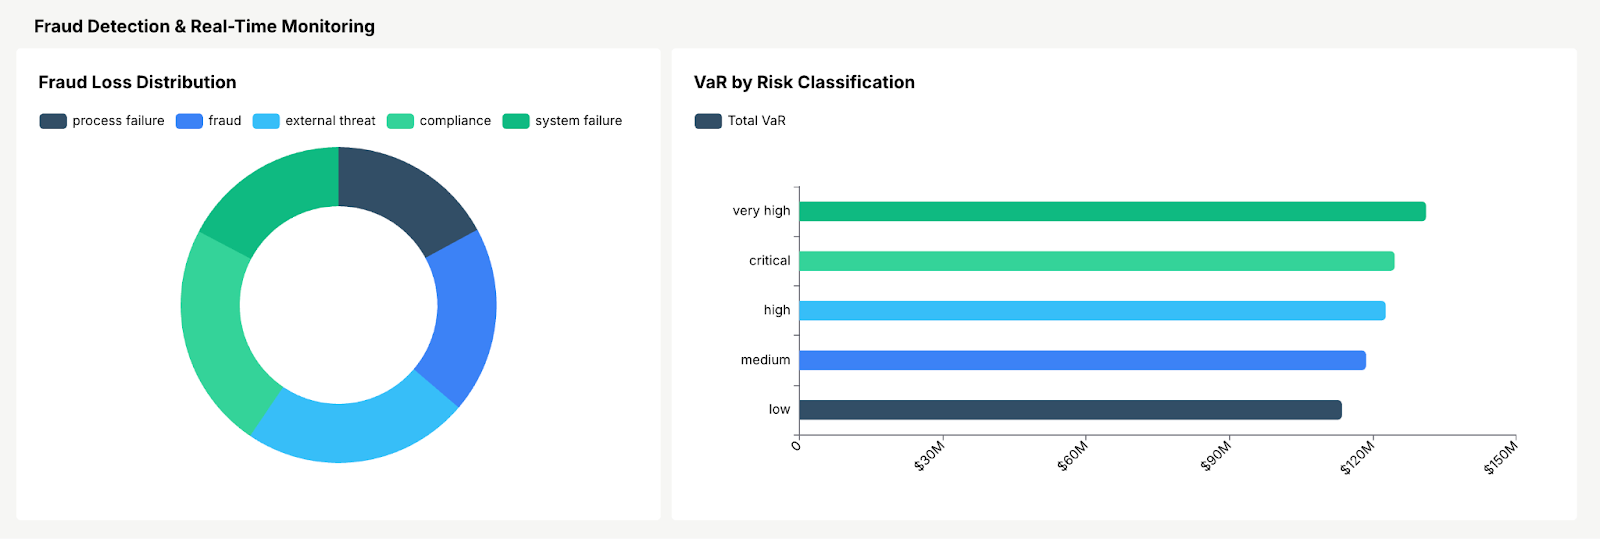
Fraud Detection and Real-Time Monitoring
Fraud in financial services isn't slowing down. The enterprise fraud management market is projected to reach $72.89 billion by 2035, and for good reason the stakes are existential.
Real-time transaction monitoring catches what rules-based systems miss: a login attempt from a location that's geographically impossible given the last login, spending patterns that deviate sharply from baseline, device fingerprints that don't match. Machine learning models trained on historical fraud data keep adapting as scammers evolve. And the payoff is measurable: ML-driven fraud detection systems reduce false positives by 30-54% compared to rules-based approaches, while cutting fraud detection costs by up to 60%. Fewer legitimate customers getting their cards frozen. More actual fraud caught.
The results at scale are striking. PayPal's AI blocks $500 million in fraud per quarter, analyzing over 500 data points per transaction across 400 million consumer accounts.
In 2026, GenAI is adding another layer: real-time analysis of conversational patterns to catch social engineering scams before money moves. Agentic AI systems are emerging that autonomously detect anomalies, investigate root causes, and recommend actions without human prompting. This is where AI in fintech analytics is heading not just pattern matching, but autonomous context understanding.
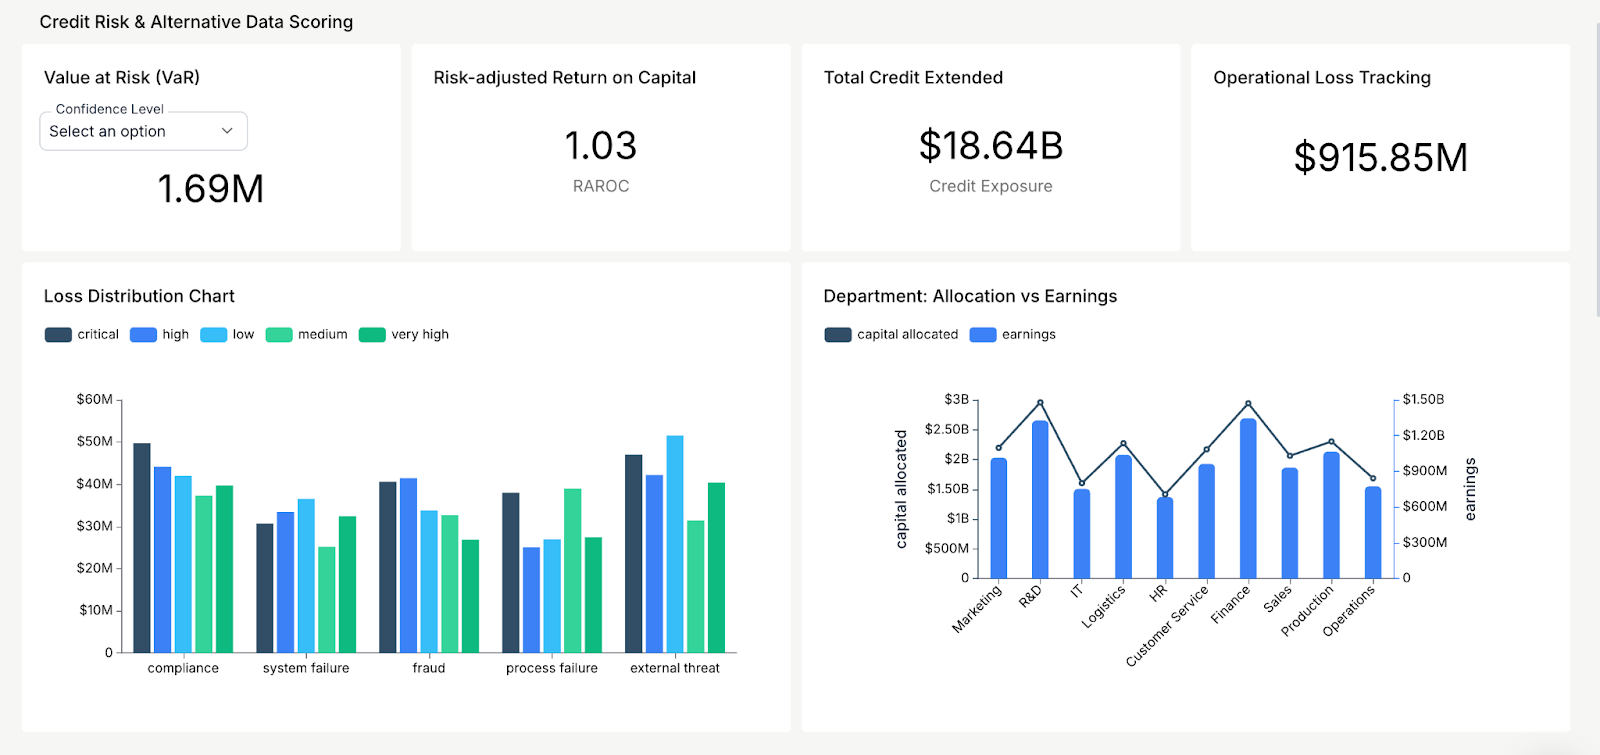
Credit Risk and Alternative Data Scoring
Credit scoring models built on bureau data alone leave massive segments underserved. Fintech lending analytics adds alternative data: cash flow consistency, savings behavior, rent payment history, utility bills to build risk assessment models that are more accurate and more inclusive.
Upstart demonstrates what's possible: their AI models approve 43% more loans compared to traditional FICO-based systems while reducing loss rates by 75% at the same approval rate. Borrowers approved via Upstart's AI receive 33% lower average interest rates, and 91% of their loans are fully automated. The result: lower default rates, broader access to credit, and financial inclusion analytics that actually work. This isn't charity. It's better underwriting.
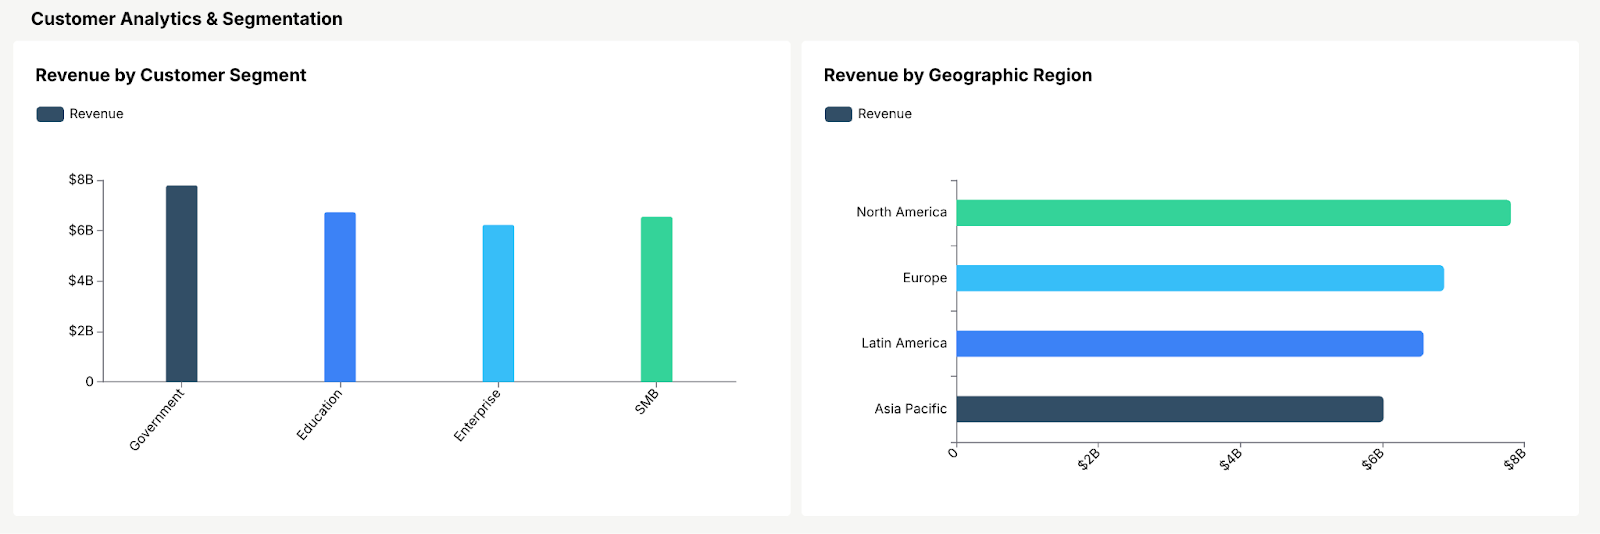
Customer Analytics and Segmentation
RFM analysis. Cohort analysis. Behavioral clustering. Churn prediction. These aren't buzzwords, they're how smart fintech companies decide where to spend marketing budget, which features to build next, which users are about to churn, and how to flag at-risk customers weeks in advance for targeted retention.
Many fintechs adopt Analytics-as-a-Service (AaaS) to get these capabilities into production faster. Why spend six months building a segmentation engine when you can ship one in weeks? The fintech customer analytics tools that win aren't the most sophisticated, they're the ones that actually get used.
Regulatory Compliance and AML
This is the section most fintech blogs skip. But if you're operating in 2026, regulatory compliance analytics isn't optional, it's the cost of being in business.
DORA (Digital Operational Resilience Act), the evolving PSD3 directive, and the EU AI Act are changing what regulators expect from fintech data governance. KYC analytics automates identity verification. Anti-money laundering (AML) data monitoring flags suspicious transaction patterns. And all of it needs audit trails that hold up under scrutiny. The KYC verification segment is growing faster than any other fintech vertical specifically because manual compliance doesn't scale.
Key Data Analytics Techniques Used in Fintech
Predictive Analytics and Machine Learning
Predictive analytics in fintech isn't just forecasting, it's the engine behind credit scoring, fraud detection, and churn prediction running simultaneously. ML algorithms get better with more data, which means your models improve as your user base grows. That's a compounding advantage your competitors can't easily replicate.
In 2026, the frontier is agentic AI: autonomous systems that don't just predict outcomes but investigate anomalies, surface root causes, and recommend actions independently. Tellius and similar platforms are already deploying AI agents that continuously monitor fintech data pipelines for deviations, eliminating the lag between detection and response.
Natural Language Processing (NLP)
NLP powers two things in fintech: customer-facing chatbots that handle support without human agents, and internal querying tools that let non-technical teams pull insights by asking questions in plain English. No SQL. No engineering tickets. That second use case is quietly transforming how product and growth teams operate.
Data Visualization and Dashboards
A wall of numbers isn't insight. Interactive charts, graphs, and digital dashboards make complex financial data legible to decision-makers who don't speak SQL. The right JavaScript data visualization libraries can turn static reports into explorable, real-time interfaces.
Effective fintech data visualization follows a few principles that separate useful dashboards from decorative ones:
- Choose the right chart type for the data. Line charts for trends over time (loan portfolio performance), bar charts for comparisons (revenue by product line), pie charts for composition (loan amounts by risk category). Using the wrong chart type is one of the fastest ways to mislead stakeholders.
- Prioritize storytelling over decoration. Titles, labels, and annotations should guide the viewer through what the data means, not just what it shows. A spike in non-performing loans needs context: is it seasonal, policy-driven, or a leading indicator of portfolio risk?
- Use color with intention. Color-code risk levels, flag anomalies, and highlight thresholds. Avoid using too many colors or palettes that fail accessibility standards for colorblind users.
In practice, fintech teams use these techniques to monitor loan portfolio health (performing vs. non-performing loans over time), visualize capital allocation across departments, and break down exposure by risk category, turning raw financial data into decisions that move fast.
Time Series and Regression Analysis
Time series analysis spots trends over time critical for financial forecasting and demand planning. Regression analysis identifies which variables actually predict outcomes (like which borrower characteristics predict defaults). Together, they're how fintech companies price products and figure out which marketing channels actually convert.
Network and Cluster Analysis
Network analysis maps relationships between entities: customers, transactions, institutions and its exceptionally good at uncovering fraud rings and synthetic identities that individual transaction monitoring misses. Cluster analysis groups similar data points for anomaly detection and customer segmentation fintech applications.
Essential Fintech KPIs to Track
Track the wrong metrics and you'll optimize for the wrong outcomes. These are the fintech KPIs that actually correlate with business health, the ones worth building dashboards around and reviewing weekly.
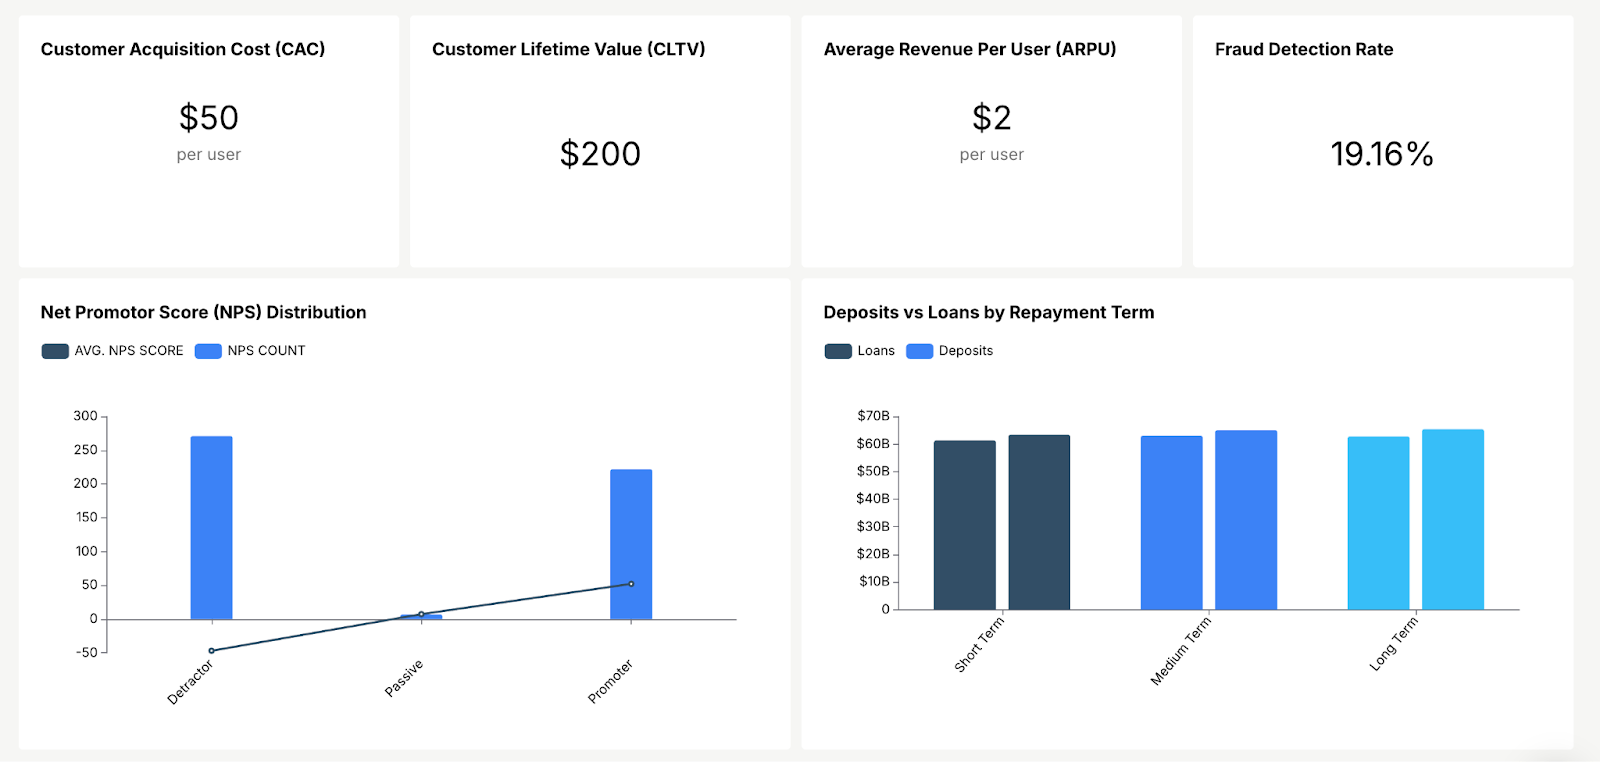
Customer Acquisition Cost (CAC)
CAC = Total acquisition costs ÷ Customers acquired.
A payment app spending $50K/month on marketing and landing 1,000 new users has a CAC of $50. That number means nothing in isolation. Compare it across channels. Kill the ones that aren't pulling their weight. Double down on the ones that are.
Monthly Active Users (MAU)
You've got a million registered users? Cool. How many actually logged in this month? If the answer is 200K, your MAU is 200K and your real user base is 80% smaller than your pitch deck says. Growing MAU means your product is sticky. Shrinking MAU means you're leaking users and probably haven't figured out why.
Average Revenue Per User (ARPU)
ARPU = Total revenue ÷ Number of users.
A money transfer service pulling $100K/month in fees across 50K active users has an ARPU of $2. Now compare that to your CAC. If you're spending $50 to acquire a user who generates $2/month, your payback period is 25 months. Is that sustainable? Only you can answer that.
Customer Lifetime Value (CLTV)
CLTV = ARPU × Average customer lifespan.
$50/year ARPU times a 4-year average lifespan = $200 CLTV. This is the number that tells you how much you can afford to spend on acquisition and retention. High CLTV justifies aggressive growth spending. Low CLTV means you've got a retention problem masquerading as a growth problem.
Net Promoter Score (NPS)
NPS = % Promoters (9-10) minus % Detractors (0-6).
A bank at 40% promoters and 30% detractors has an NPS of 10. Not great. But at least they're measuring it. You can monitor all of these KPIs in one place using a fintech analytics dashboard, see fintech dashboards for examples.
Fraud Detection Rate and False Positive Rate
What percentage of actual fraud are you catching? And how many legitimate transactions are you blocking in the process? Optimizing this ratio directly protects revenue (fewer false blocks) and trust (fewer fraud losses). If you're not tracking both sides, you're flying blind on real-time transaction analysis.
Churn Rate
Churn Rate = (Customers at start of period - Customers at end of period) ÷ Customers at start of period.
A neobank starts Q1 with 200,000 users and ends with 180,000. That's a 10% churn rate meaning the company loses one in ten customers every quarter. At that pace, the entire user base turns over in under three years. Churn rate is a leading indicator of product-market fit: high churn means users aren't finding enough value to stick around, and no amount of acquisition spend can outrun it. Track churn by cohort (sign-up month, acquisition channel, plan tier) to pinpoint where retention breaks down.
Gross Payment Volume (GPV)
GPV = Total value of all transactions processed over a given period.
A payment processor handling $12 million in transactions in March has a GPV of $12M. This metric reflects the scale and throughput of your platform, it's the top-line indicator of how much financial activity flows through your product. Rising GPV signals growing adoption and platform trust. Stagnant GPV despite growing users suggests low transaction frequency or value per user, which points to engagement or pricing problems.
Loan Default Rate
Loan Default Rate = (Number of defaulted loans ÷ Total number of loans) × 100.
A P2P lending platform with 1,000 active loans and 50 defaults has a 5% default rate. That sounds small, but depending on average loan size and margin, even a 5% default rate can wipe out profitability. This KPI is the single most important risk metric for any lending fintech. Track it alongside your credit scoring model's predictions if your model forecasts 2% defaults but reality delivers 5%, your underwriting has a calibration problem.
How Embedded Analytics Powers Fintech Products
Tracking KPIs internally is half the game. The data-driven fintech companies pulling ahead in 2026 are the ones putting analytics directly into their customers' hands.
Embedded analytics for fintech products means merchants see their payment trends, borrowers track credit health, advisors monitor portfolios all without leaving your platform. 81% of fintech companies now embed analytics as a standard feature and those that do report measurably higher user engagement and retention. Explore embedded analytics trends and the benefits of embedded analytics for the full picture.
Building this in-house? Budget $700K to $1.2M over three years once you account for engineering, compliance certification, maintenance, and the opportunity cost of pulling developers off your core product. Most teams underestimate this by at least 40%. Many fintechs embed customer-facing analytics instead, and teams increasingly adopt self-service analytics tools to let non-technical users explore data independently.
Building a Fintech Data Analytics Strategy for 2026
Define Your Analytics Maturity Level
Be honest about where you actually are. Basic Reporting (spreadsheets and static dashboards). Diagnostic Analytics (you can explain why metrics moved). Predictive Analytics (you forecast what's coming). Prescriptive Analytics (automated recommendations and triggered actions). Most fintechs think they're at stage three. Most are actually stuck at stage two.
Choose Build vs. Buy
In-house analytics gives you control. But control costs $700K-$1.2M over three years when you stack up engineering salaries, cloud infrastructure, compliance audits, and the features your team didn't build because they were busy building dashboards. Embedded platforms deliver equivalent capabilities in days at a fraction of the cost. Run the numbers before committing.
Prioritize Real-Time Over Batch Processing
Batch analytics tells you what happened yesterday. Real-time analytics for fintech apps lets you act right now blocking fraud in milliseconds, triggering personalized offers at the exact moment of engagement, surfacing compliance flags before they escalate. In 2026, batch processing isn't a strategy. It's technical debt.
How Databrain Enables Fintech Analytics
Databrain is built for fintech teams that need analytics inside their product — not tacked on as an afterthought.
Natural language querying means your product and growth teams ask questions in English and get answers. No SQL, no engineering queue, no waiting two weeks for a dashboard that's already stale.
Embeddable, white-label dashboards drop straight into your fintech app. Your users get real-time fintech analytics dashboard examples they can actually explore. Check out embedded analytics tools and fintech dashboards to see how it works.
Role-based access and audit trails handle DORA, PSD3, EU AI Act, and AML compliance out of the box. Your compliance team stops losing sleep.
Databrain provides embedded financial analytics built specifically for fintech. Your engineers stay focused on your core product. Your users get the insights they need. And your compliance team gets the documentation regulators demand.
See it on your data. Explore live fintech dashboard samples below, then book a personalized demo to walk through embedding, security, and your roadmap with our team or start building free and ship white-label analytics in days, not quarters.
Frequently Asked Questions
What is data analytics in fintech?
It's the process of collecting, cleaning, and analyzing financial data to make better decisions across risk management, fraud detection, customer personalization, and compliance. Fintech companies use predictive analytics, machine learning, NLP, and visualization tools to turn raw transaction data and user behavior into actions that move the business forward.
How is data analytics used for fraud detection in fintech?
Through real-time transaction monitoring, ML models trained on known fraud patterns, and anomaly detection that flags suspicious activity as it happens. Modern systems catch impossible-location logins, unusual spending spikes, and device mismatches cutting false positives by 30-54% compared to rules-based approaches. PayPal's AI, for example, blocks $500 million in fraud per quarter by analyzing over 500 data points per transaction.
What are the most important KPIs for fintech analytics?
The core set includes CAC (Customer Acquisition Cost), MAU (Monthly Active Users), ARPU (Average Revenue Per User), CLTV (Customer Lifetime Value), NPS (Net Promoter Score), Churn Rate, Gross Payment Volume (GPV), Fraud Detection Rate, and Loan Default Rate. Together they tell you whether your growth is efficient, your users are engaged, your risk is managed, and your economics actually work.
What's the difference between fintech analytics and traditional financial analytics?
Traditional financial analytics is backward-looking and institution-focused quarterly reports, historical trend analysis, board decks. Fintech analytics is real-time, product-embedded, and customer-facing. It uses alternative data sources like behavioral signals and open banking data that traditional finance rarely touches.
What is embedded analytics in fintech?
Dashboards, reports, and data exploration built directly into your fintech app so end users merchants, borrowers, advisors get insights without ever leaving your product. 81% of fintech companies now treat this as a standard feature, not a premium add-on.


